![]()
________________________________________
System Status
The System Status tab, shown in MAKE, provides user events that identify issues that affect or prevent machine operation.
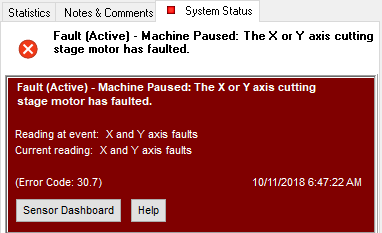
System Status Primary Events
Event
A separate event displays for each machine issue. Events can be faults or alerts. Events can also be active or inactive. The System Status tab displays events in the order of their occurrence with the most recent event at the top.
Fault
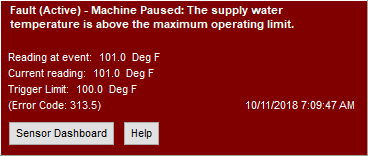
A fault is an event that requires the machine to stop operating. An active fault is displayed with a maroon background; an inactive fault is displayed with a gray background.
Alert
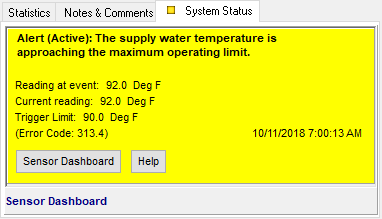
An alert is an event that does not require a machine shutdown, but identifies a potential problem that must be corrected later. In an alert state, the machine is allowed to continue running. An active alert is displayed with a yellow background; an inactive alert is displayed with a gray background.
Active Event
Fault and alert events can be active. In this state, the monitoring software indicates to MAKE that the conditions for the event are actively happening. The event list displays active events in yellow or maroon; “Active” is included in the event title. Active events cannot be dismissed.
Inactive Event
Fault and alert events can be inactive. In this state, the condition that triggered the event is no longer happening. This does not mean that the issue causing the original event has been resolved—the triggering of the event could have been momentary and not persistent. The event list displays inactive events in gray; “Inactive” is included in the event title. Inactive events can be from the event list.
System Status Event Displays
The System Status tab communicates different states of operation.
No Machine Connected
In this state, MAKE is not connected to the controller card. No event displays and there is no icon on the System Status tab.

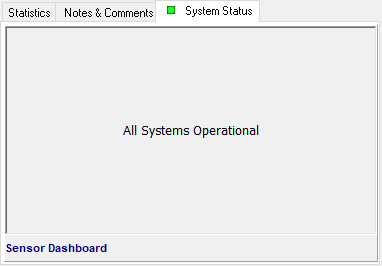
All Systems Operational
In this state, a green icon displays on the System Status tab. Click on the tab to see that there are no active events.
Inactive events can still display when all systems are operational.
Alert
An alert is a notice that there is potential for a more severe event to occur. In this situation, the System Status tab icon changes to yellow. Also, because a new event has been triggered, MAKE automatically opens the System Status tab. The alert event, active or inactive, displays. If the condition that caused the alert ceases, the icon will once again change to green, indicating that all systems are operational. An inactive alert will continue to display.
Fault
When a Fault event occurs, the System Status tab icon changes to flashing red. Because this is a new event, MAKE automatically opens the System Status tab. A panel above the events section provides additional notice on the latest fault that caused the machine to pause.
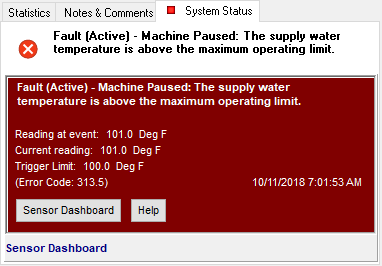
If the condition that caused the fault ceases, the System Status tab icon again changes to green, indicating that all systems are operational. The fault event panel and the fault itself still display “inactive” until the user them.
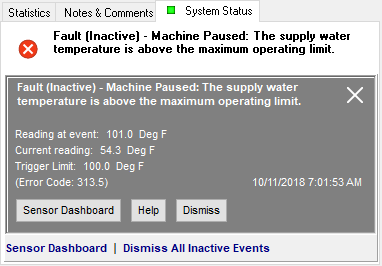
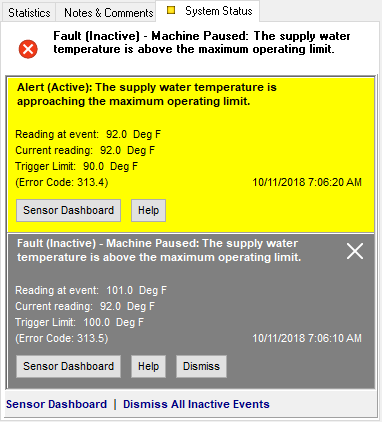
If an event condition starts as an alert, then worsens to a fault, the fault replaces the alert.
Sometimes an event can be shown as both an active alert and an inactive fault. This happens when conditions improve enough to render the fault inactive, but still have potential to worsen.
Basic Description of Events
The event title consists of three parts:
- Alert or fault
- Active or inactive
- Event description
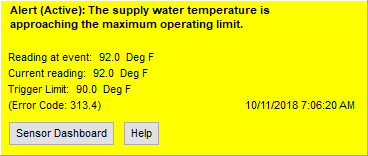
Active alerts are yellow and identified as "Active."
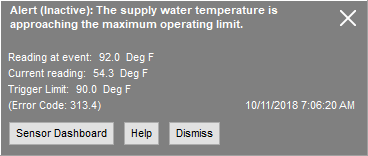
Inactive alerts are gray and identified as “Inactive.”
Active faults are maroon and identified as “Active.”
Inactive faults are gray and identified as “Inactive.”
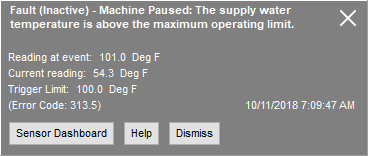
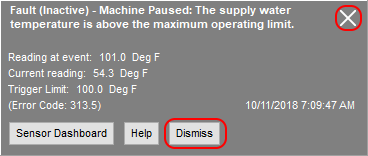
If an event is inactive, a Close button appears on the right side of the event banner. Click it or Dismiss to close the event.
Detailed Description of Events

Title
The title identifies the event as a fault or an alert, indicates whether it is active or inactive, and describes the event.
Reading at event
This refers to the reading taken that triggered the event.
Current reading
This refers to the current reading taken from the same sensor that triggered the event. It may or may not be identical to the reading taken when the event was triggered.
Trigger Limit
The trigger limit refers to the threshold of what would trigger the alert or fault. This field only displays if the limit is a numerical value. If the event was triggered by a true/false statement (such as "on or off," "opened or closed"), the field will not display.
Error Code
The error code identifies the event. When communicating with Technical Support, it is convenient to provide the error code.
Date and time
The date and time stamp identifies the moment the event became active. If an event becomes inactive and then active again, the date and time will update to the latest.
Sensor Dashboard
Click to open the sensor dashboard, a utility meant to provide an overview of all of the items monitored on the Abrasive Waterjet Machine.
Help
For more information about the event, click Help. The Help documentation provides a detailed description of the problem as well as any steps to resolve it.

Dismiss
The Dismiss button displays only if an event is in an inactive state. Click Dismiss to remove the inactive event from the System Status tab.

Dismiss All Inactive Events
This button displays at the bottom of the System Status tab, when at least one inactive event is listed. Click Dismiss All Inactive Events to remove all inactive events from the System Status tab.
